

Connect. Automate. Empower.

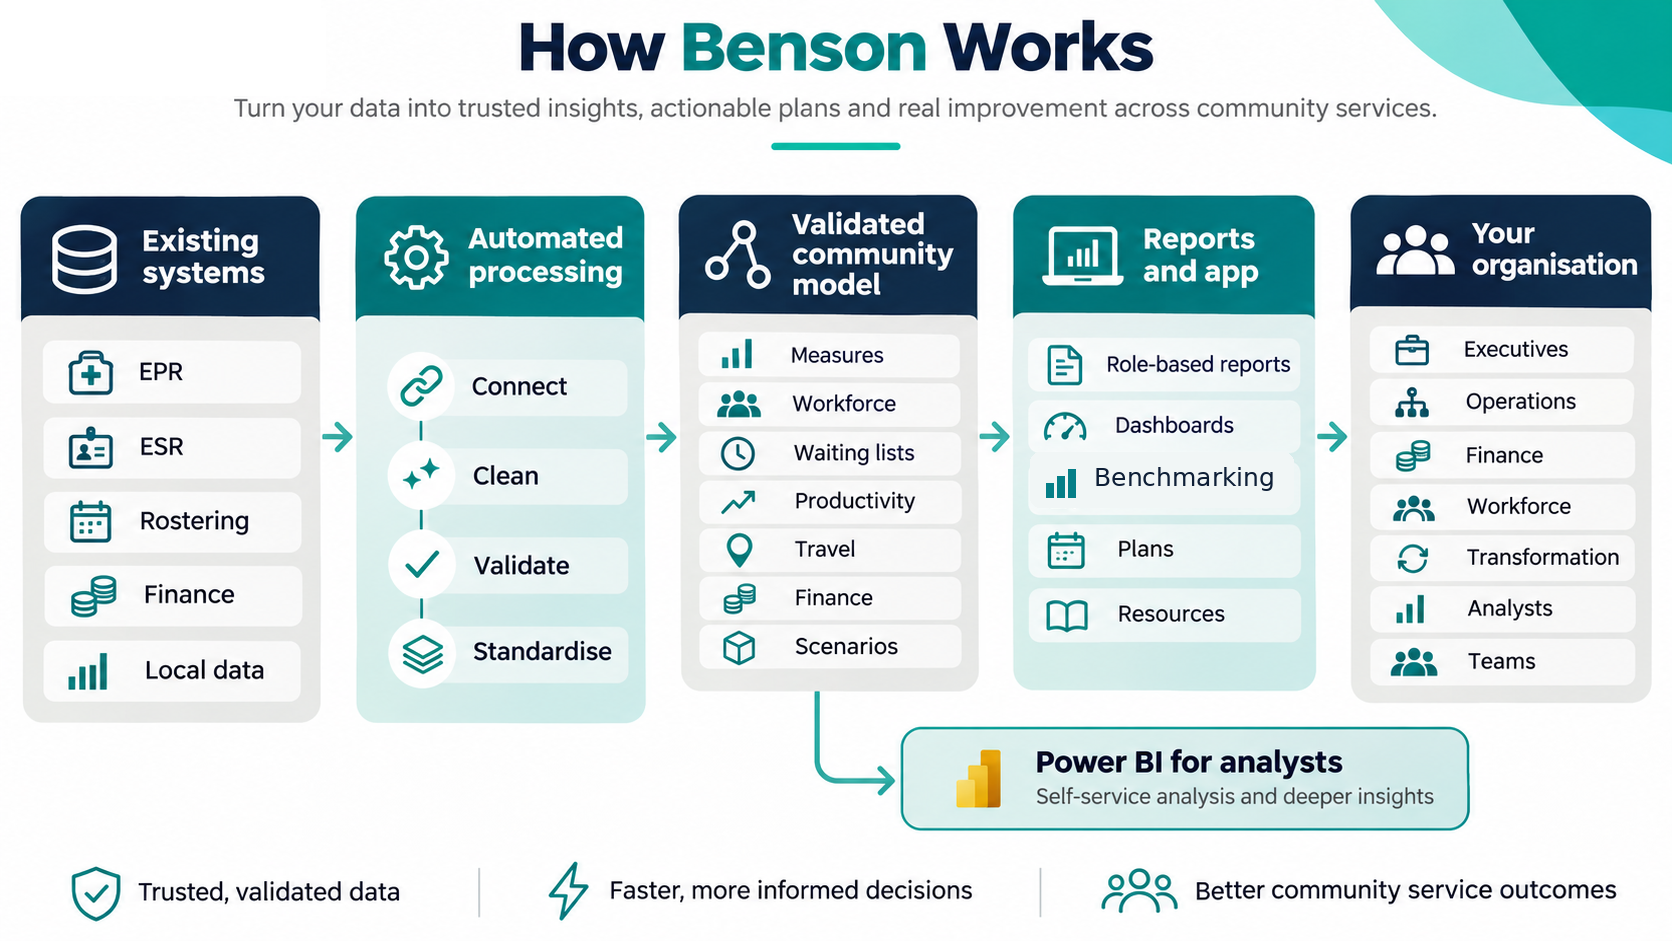
Benson connects with your existing clinical systems to automate reporting, performance tracking, planning and workforce optimisation.

Configured around your services and data, Benson replaces unnecessary spreadsheets, repeated data manipulation and manual report-building with robust, standardised metrics and a reusable evidence base.

Give operational managers, transformation teams, finance, analysts and leaders more objective, comparable and timely insight into performance, productivity, capacity and variation — then plan future services from the reality of your own historic service baseline.

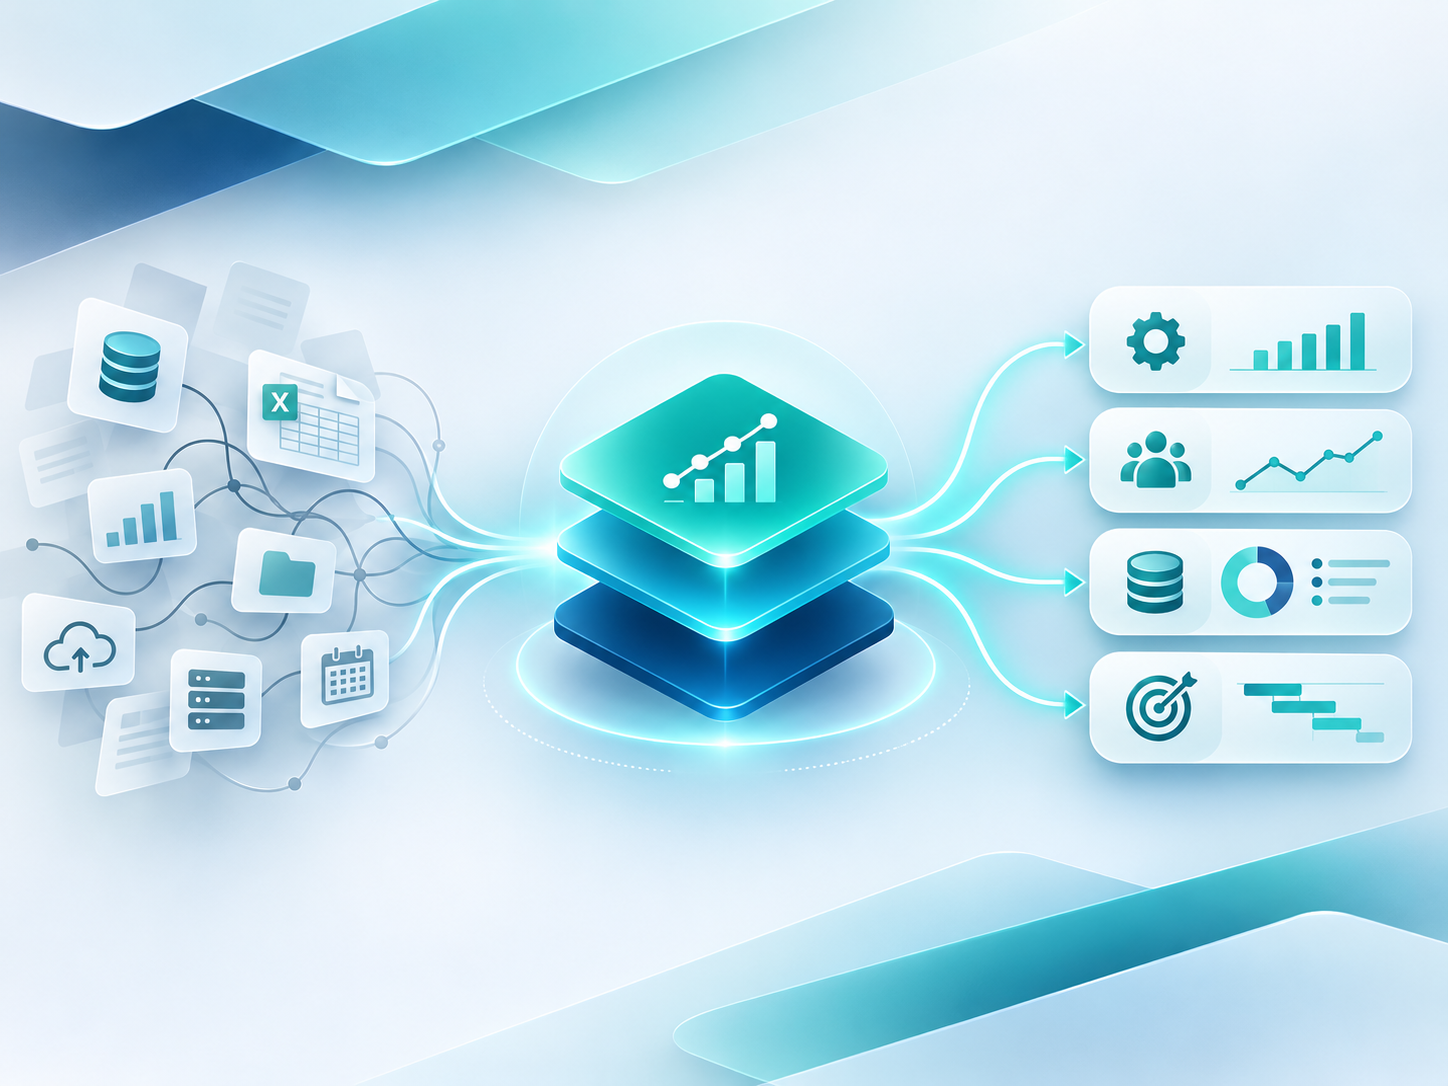
Your data flowing through the Benson model into analysis, planning and action
~60%time saving on periodic reporting
Since 2012developed through real community-service delivery
60+community providers and commissioners
200+community projects completed
150+community metrics and planning measures available as a starting framework
Tangible outcomes

What Benson helps decision-makers actually achieve.

Start with the operational outcome, then use the same validated model to understand the problem, test the change and track whether it works.

Configured, not bespoke-built

Connect Benson to what you already have and put a proven capability in the hands of your organisation.

Benson already contains established community measures, reporting structures, planning logic and transformation tools. We configure them around your services, systems, teams, targets, budgets and priorities rather than starting with a blank BI build.

The result is an automated and systematic capability that your organisation can keep using and adapting — reducing dependency on one-off consultancy, bespoke spreadsheets and repeated manual report production.

Data feeding a configurable intelligence and planning model that supports organisational decisions
One capability across the organisation

Different teams get the insight and tools they need from the same trusted model.

Managers & service leads

See workload, productivity, caseload, allocation, travel, variation and workforce pressure so they can manage performance and staff sustainability more intelligently.

Transformation teams

Identify the opportunity, build the case for change, model alternative options, set measurable targets and track whether programmes deliver the expected benefits.

Finance

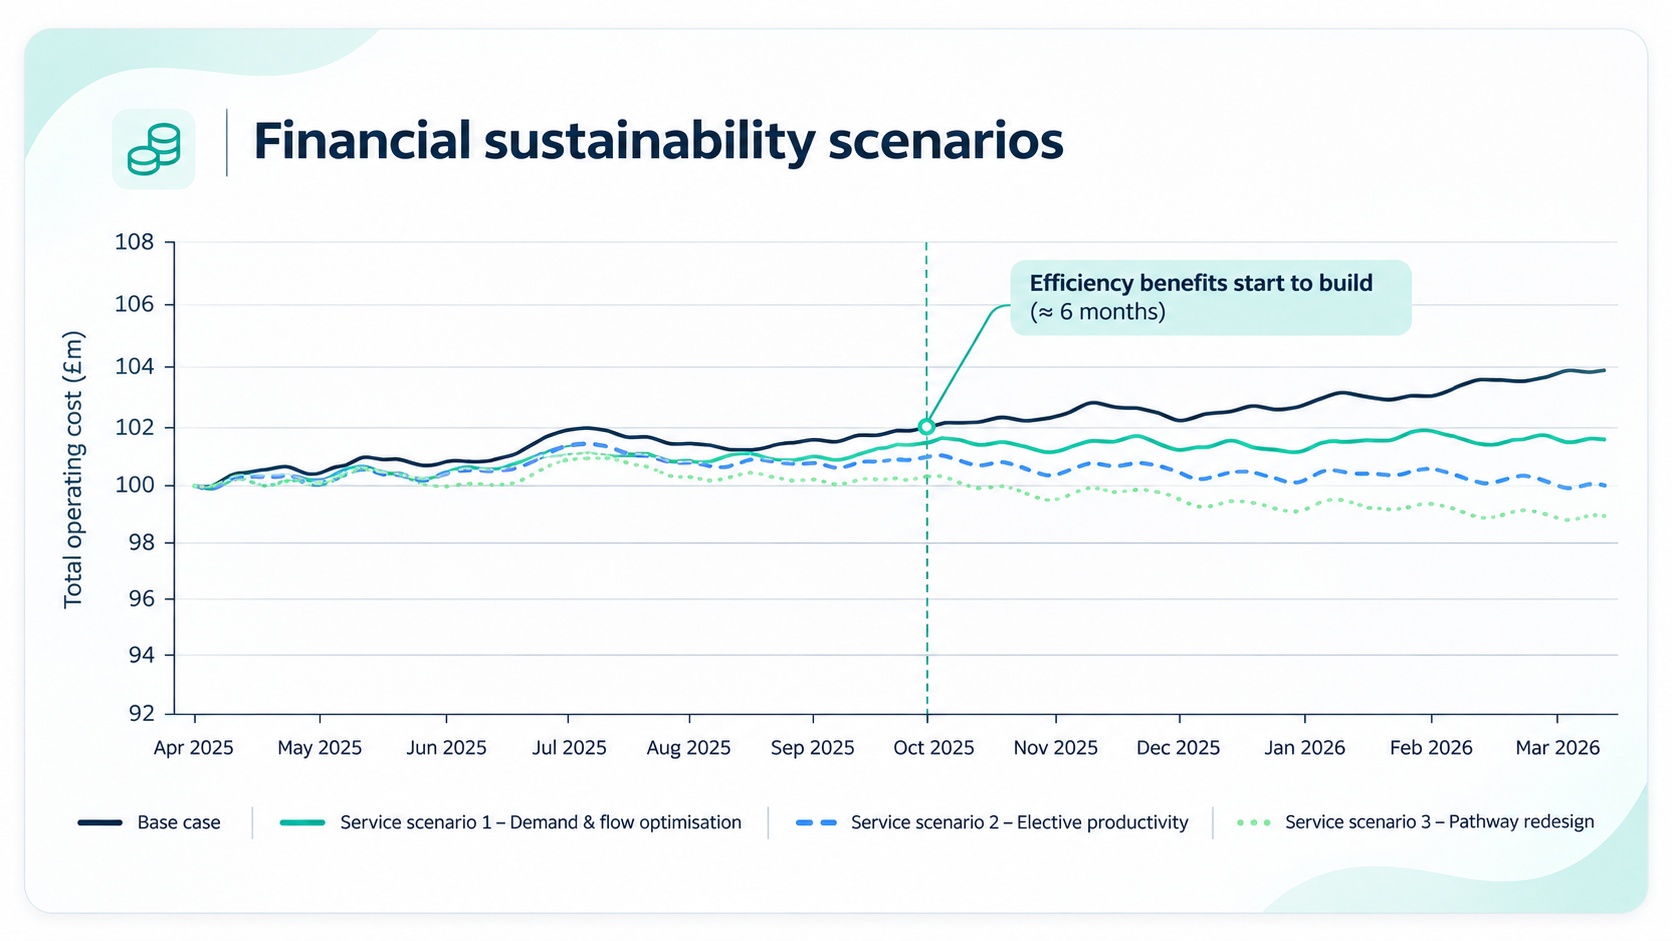
Connect budgets, savings, workforce costs, productivity and investment choices to the operational consequences and test whether financial plans are genuinely deliverable.

Workforce teams

Link current WTE, role mix, vacancies and productive capacity to demand and future service models to understand what workforce is actually required.

Analysts & BI

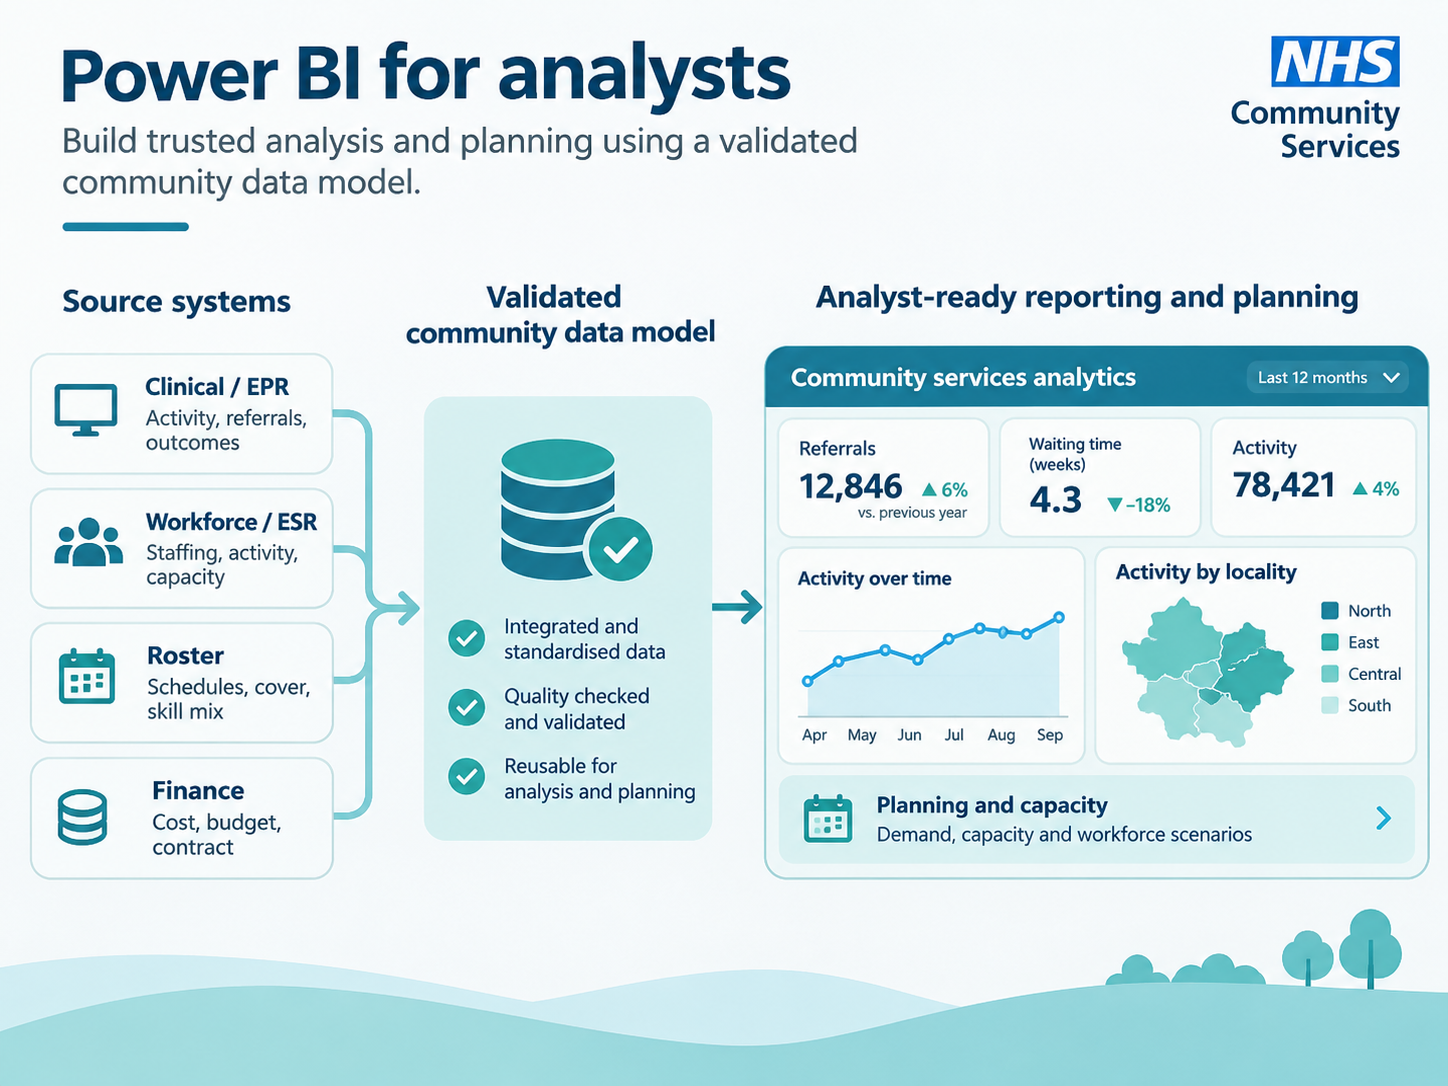
Benson sets up the data platform, validated model, definitions and community measures. Your analysts can then use that model in Power BI to build and extend their own reports and analysis, while routine production reporting is automated.

Executives & strategy

Use one evidence base to set targets, allocate resources, develop service strategies and monitor delivery across teams and localities.

Reduce the reporting burden

Less spreadsheet building. More time understanding what the data is telling you.

Benson automates the repeatable work around your existing systems: loading, validating, standardising, calculating and refreshing agreed measures. Instead of rebuilding reports through Excel, copy/paste and repeated reconciliations, the same robust metrics are produced consistently and made available to the people who need them.

  • Reduce manual exports, copy/paste, spreadsheet manipulation and repeated calculations
  • Replace multiple local versions of the same metric with standardised definitions
  • Refresh reports and measures systematically rather than rebuilding them each period
  • Give managers, transformation and finance teams direct access to timely, comparable information
  • Free analysts for investigation, assurance, development and higher-value analysis
Fragmented source data becoming a reusable intelligence environment
Plan from reality, not generic assumptions

Baseline. Compare. Decide. Model. Track.

Benson uses your historic service baseline to show how services actually operate: demand, productivity, capacity, skill mix, caseload, workload, travel and access. Compare teams, identify variation from attainable good practice, test alternative scenarios and track whether the expected improvement is delivered.

BaselineCompareScenarioDecideTrack
Community services, locality and resource planning
Community-specific intelligence

See what generic corporate reporting usually misses.

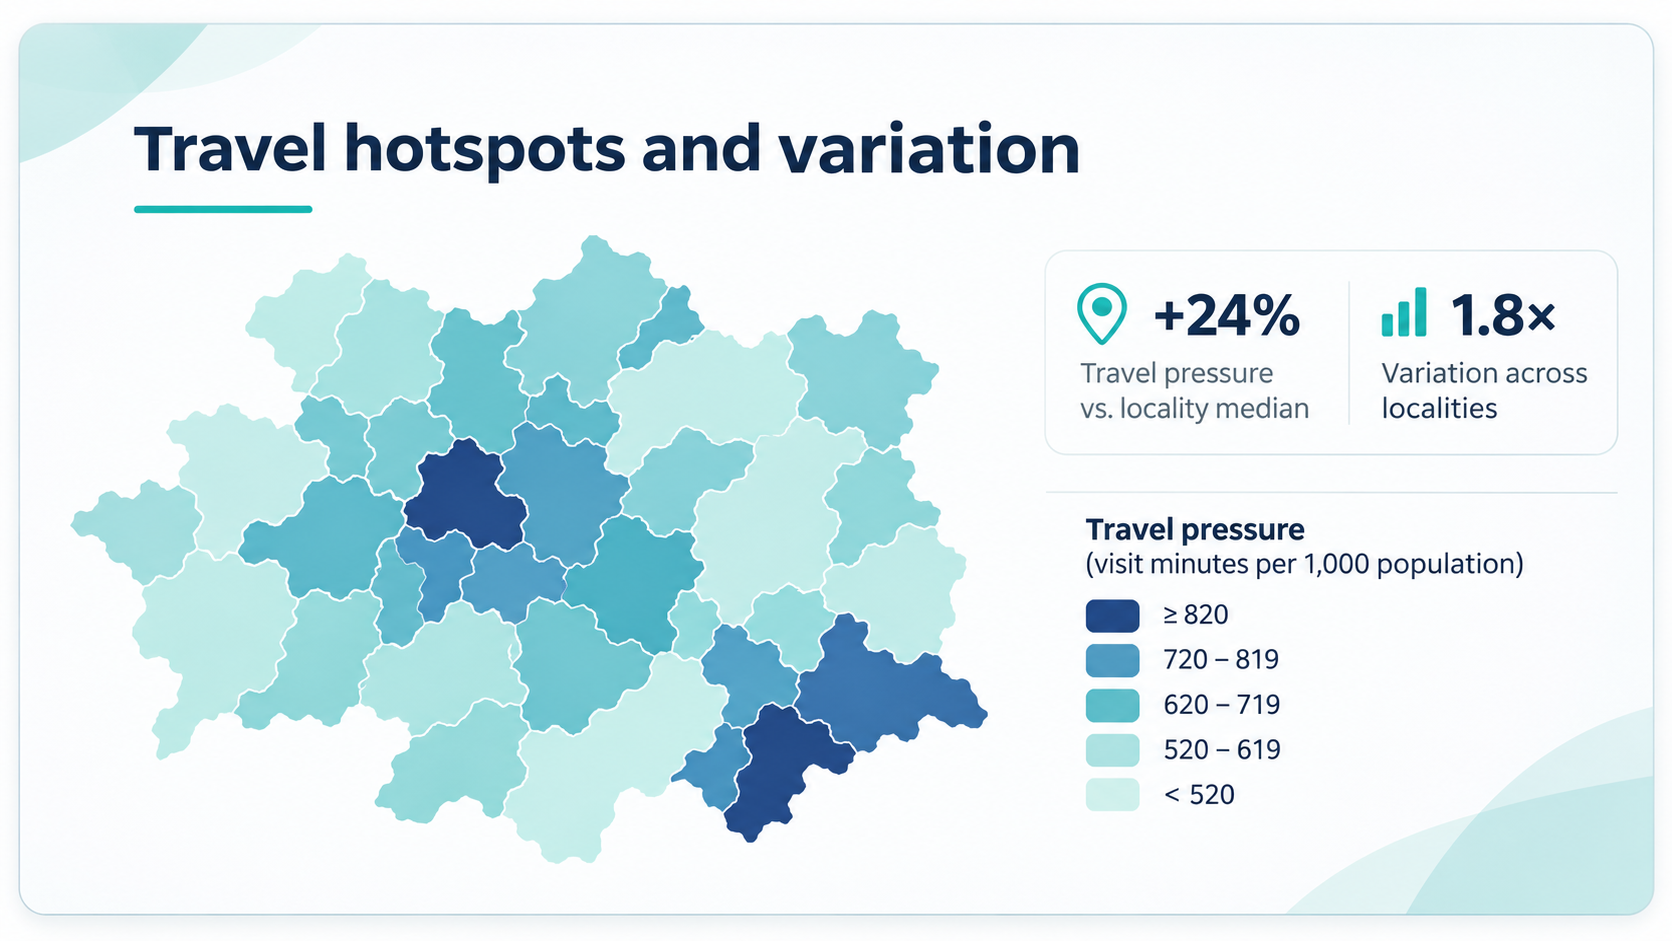
  • Travel and geography by locality
  • Caseload and workload distribution
  • Staff productivity, allocation and variation
  • Workforce pressure and sustainability
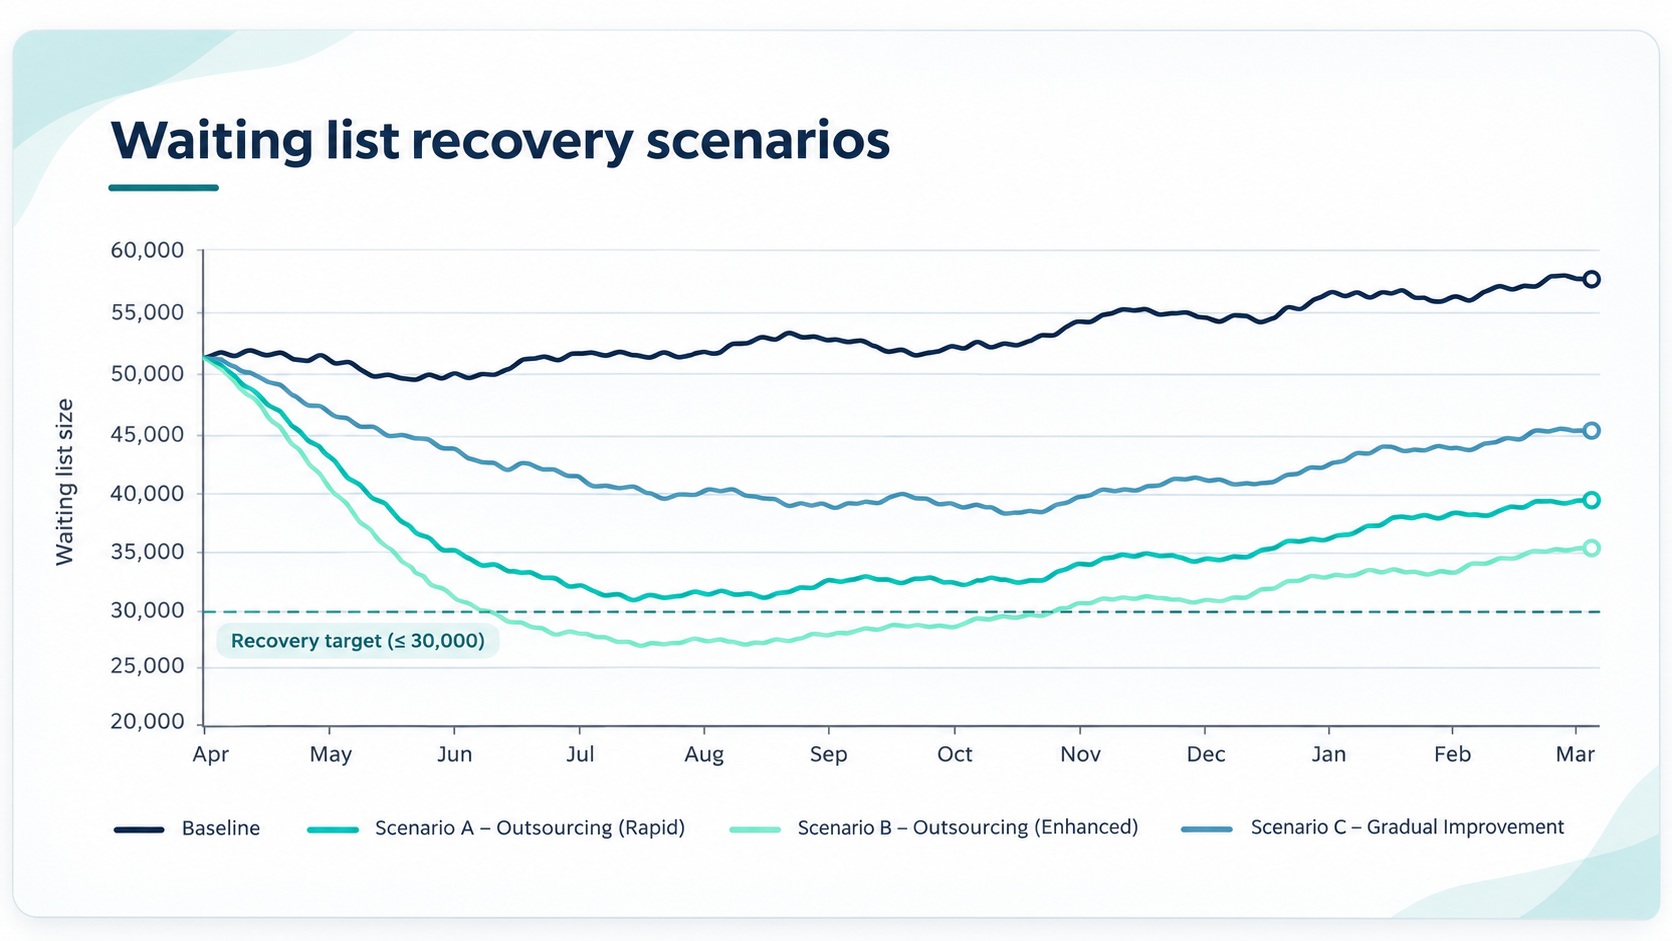
  • Waiting-list trajectories and pathway flow
  • Financial and operational consequences of different service models
Your model, your priorities

Configure Benson around the way your organisation actually works.

Use your own service structures, localities, strategies, KPIs, targets, workforce assumptions and financial plans. Local administrators manage access and content through the App, while Benson establishes the validated Power BI data model and community measures, which client analysts can then use to build and extend their own reports.

Power BI for analystsBenson sets up the platform, validated data model and community measures; your analysts can then build and extend reports using that foundation.Benson App for the organisationShare reports, plans, forms and resources with controlled access.
NHS & public-sector experience

Built through work with community providers across the UK.

Current and historic clients shown to illustrate the breadth of settings that have helped shape the model.

Evidence from real programmes

Case studies show how the model is being used in practice.

Built for NHS environments

A practical operating model, not another isolated analytics project.

Deployment and governance are designed around the controls, ownership and operating realities of NHS and public-sector services.

Controlled access

Role-based user access and local administration through the Benson App.

Data quality built in

Validation, standardisation and visible data-quality controls before measures reach reports.

Flexible deployment

Models can operate in the client environment, with Benson supporting the data model, reporting and adoption.

References available

Current and recent NHS clients can evidence how the model is used in practice.

The Benson method

Connect. Standardise. Understand. Model. Plan. Act. Track.

The methodology is designed to move from routine operational data to a managed programme of change without rebuilding the analytical foundation each time.

Explore the Benson Model →
ConnectStandardiseUnderstandModelPlanActTrack
Starting framework

150+ measures, workforce and demand logic, geography and travel modelling, benchmarking, scenario planning and change tracking.

What managers actually receive

Show the evidence, not just the proposition.

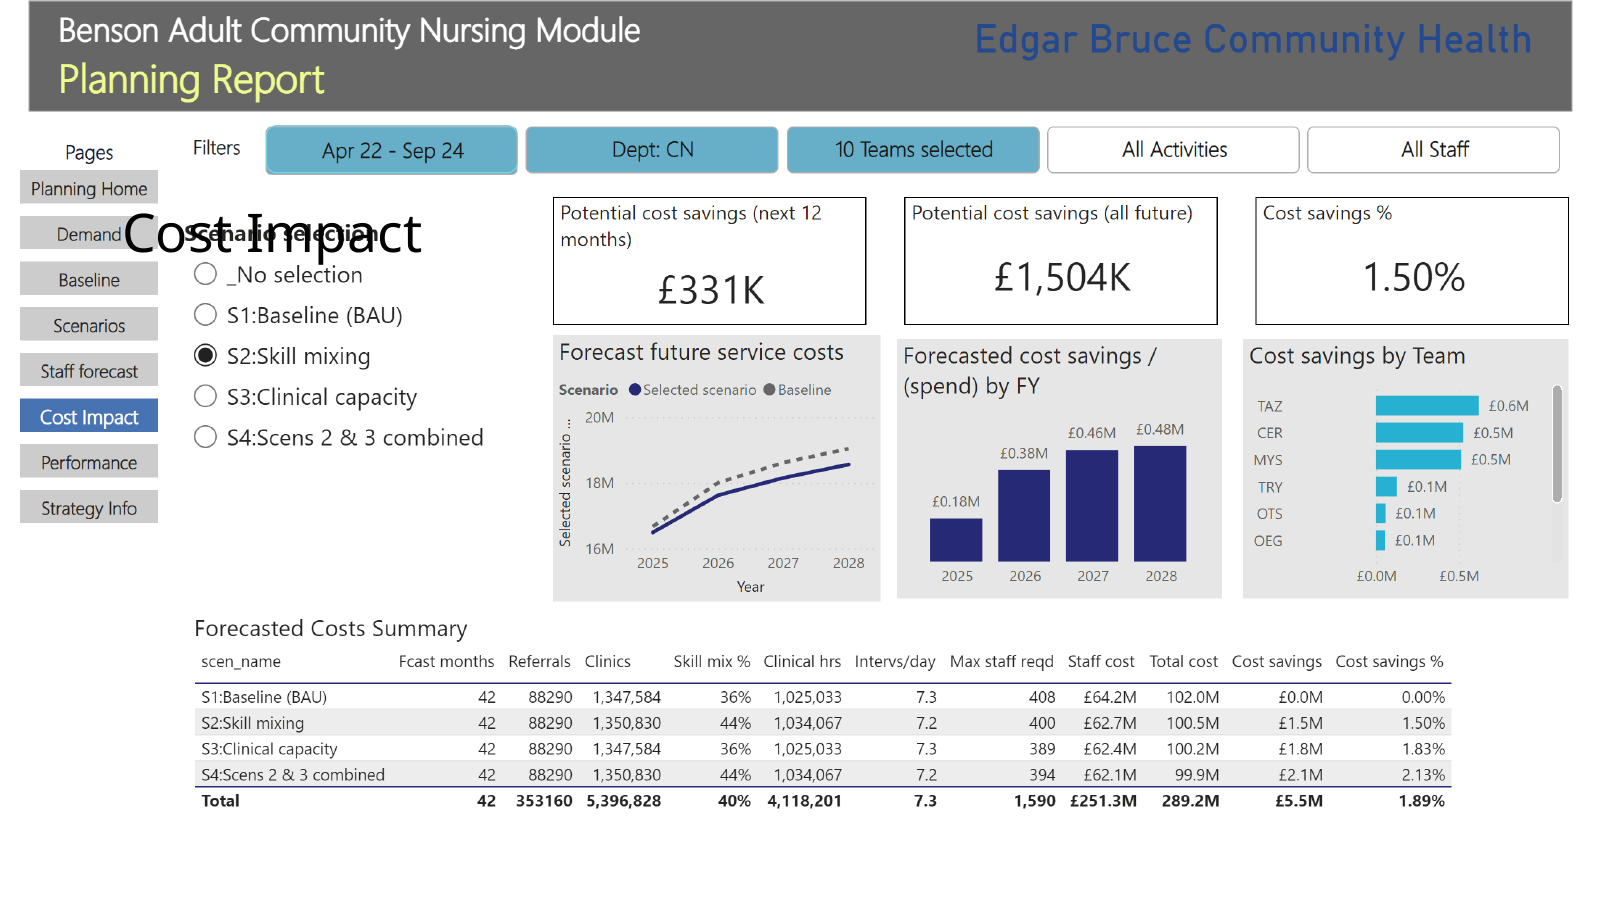
These examples are taken from Benson demo reports built around the same reporting and planning structures used in live programmes. Client outputs are configured around local data, measures and priorities.

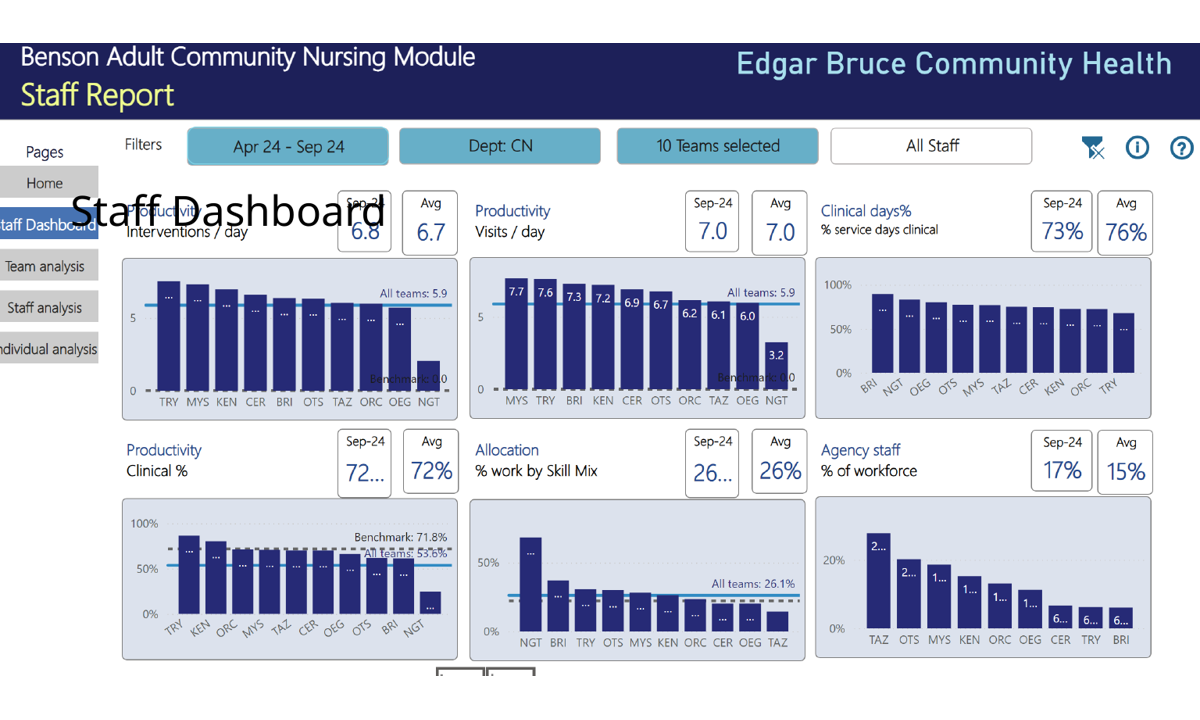
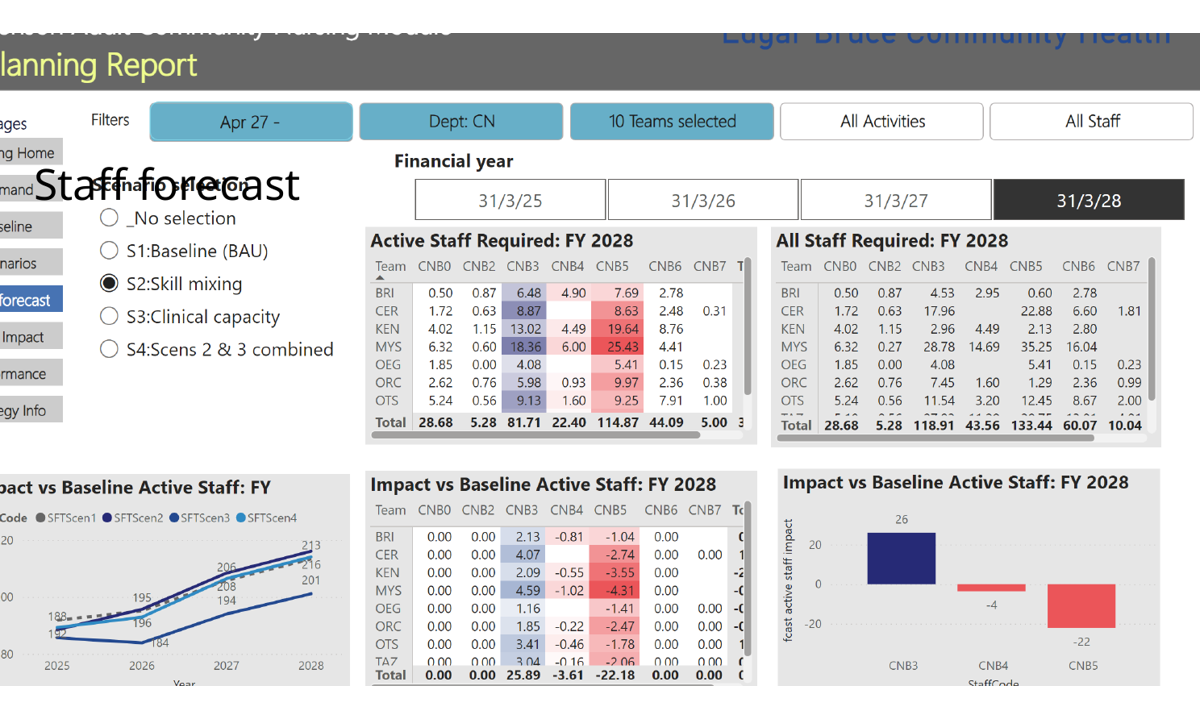
Benson Staff Report dashboard
Workforce & capacityCurrent vs required staffing, allocation and workload.
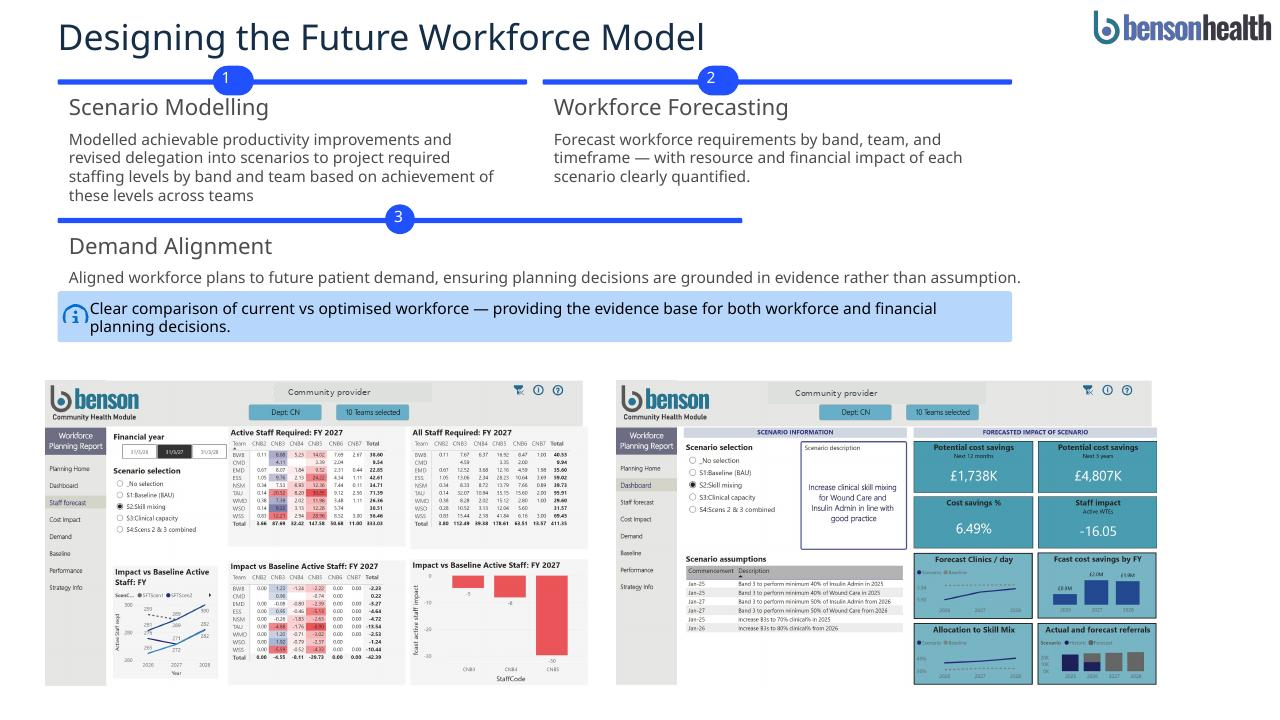
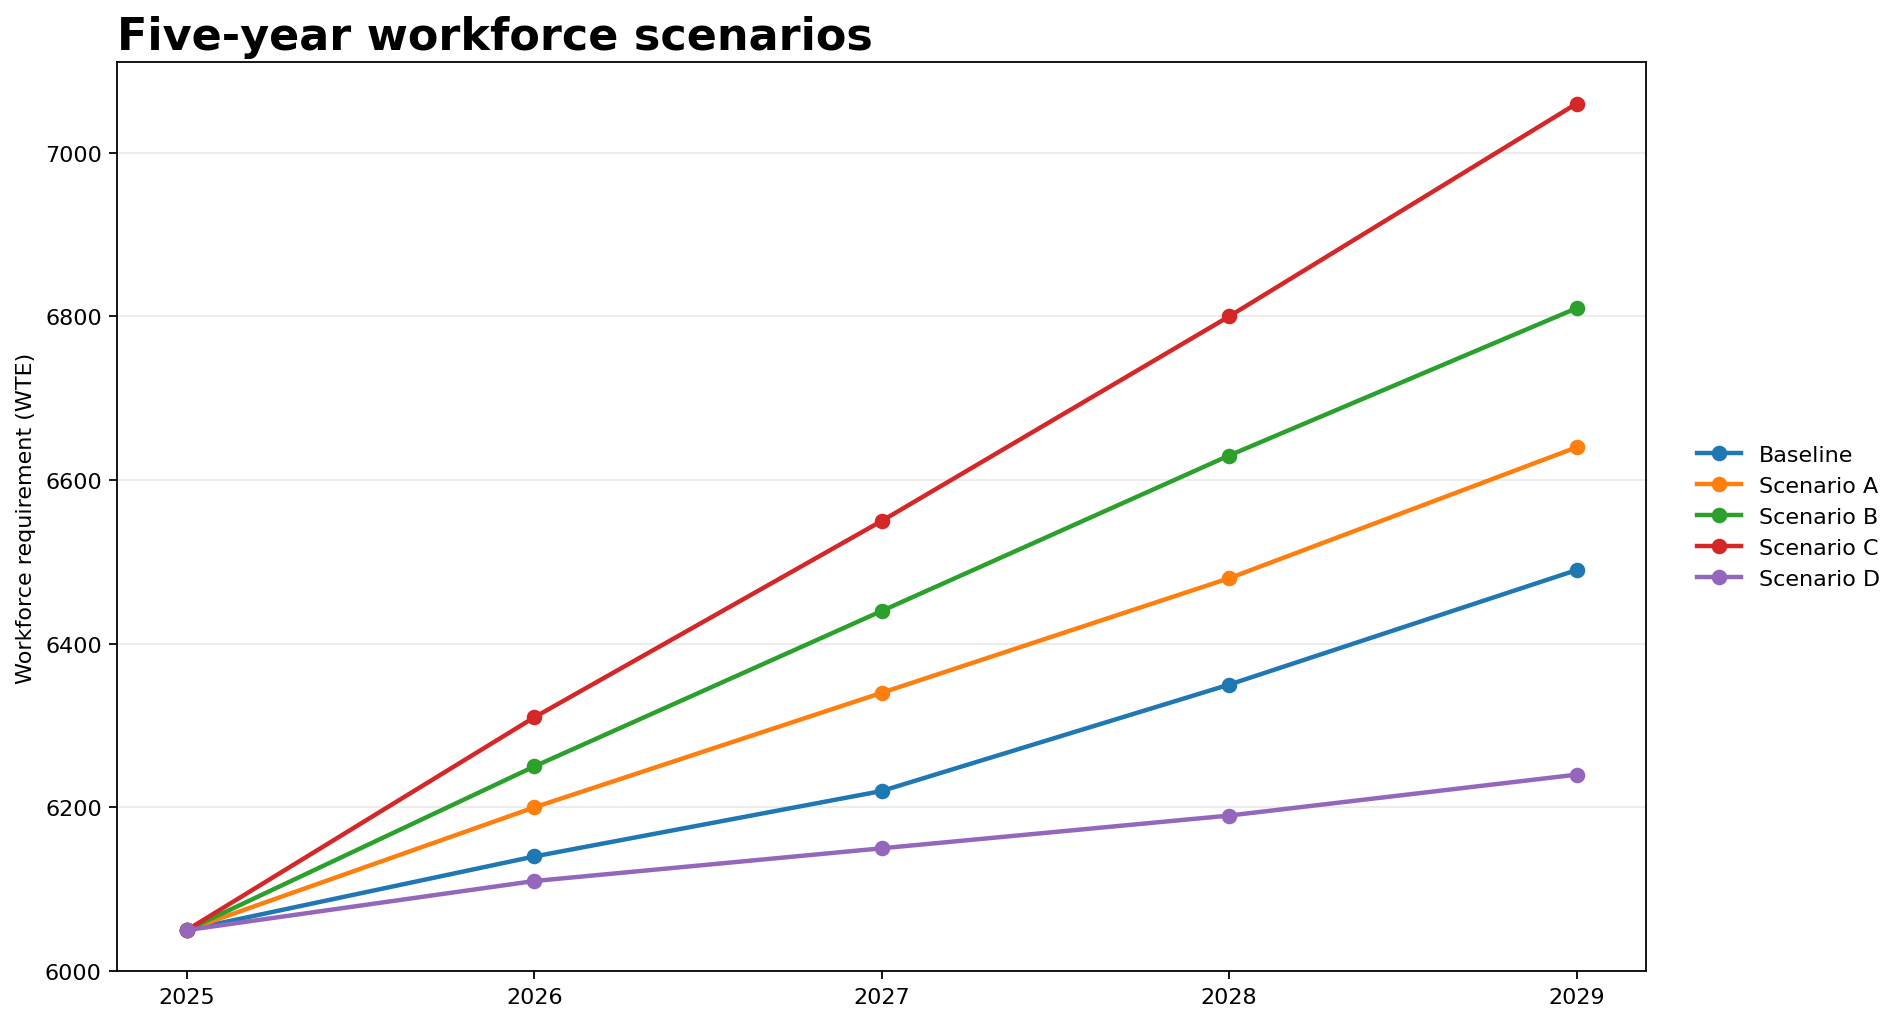
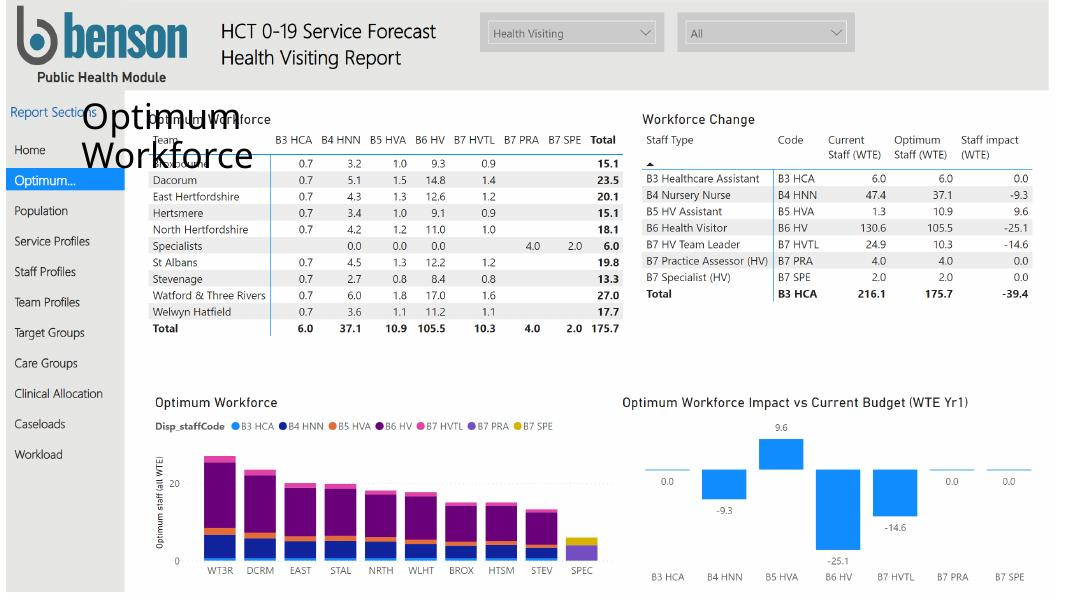
Benson workforce scenario planning report
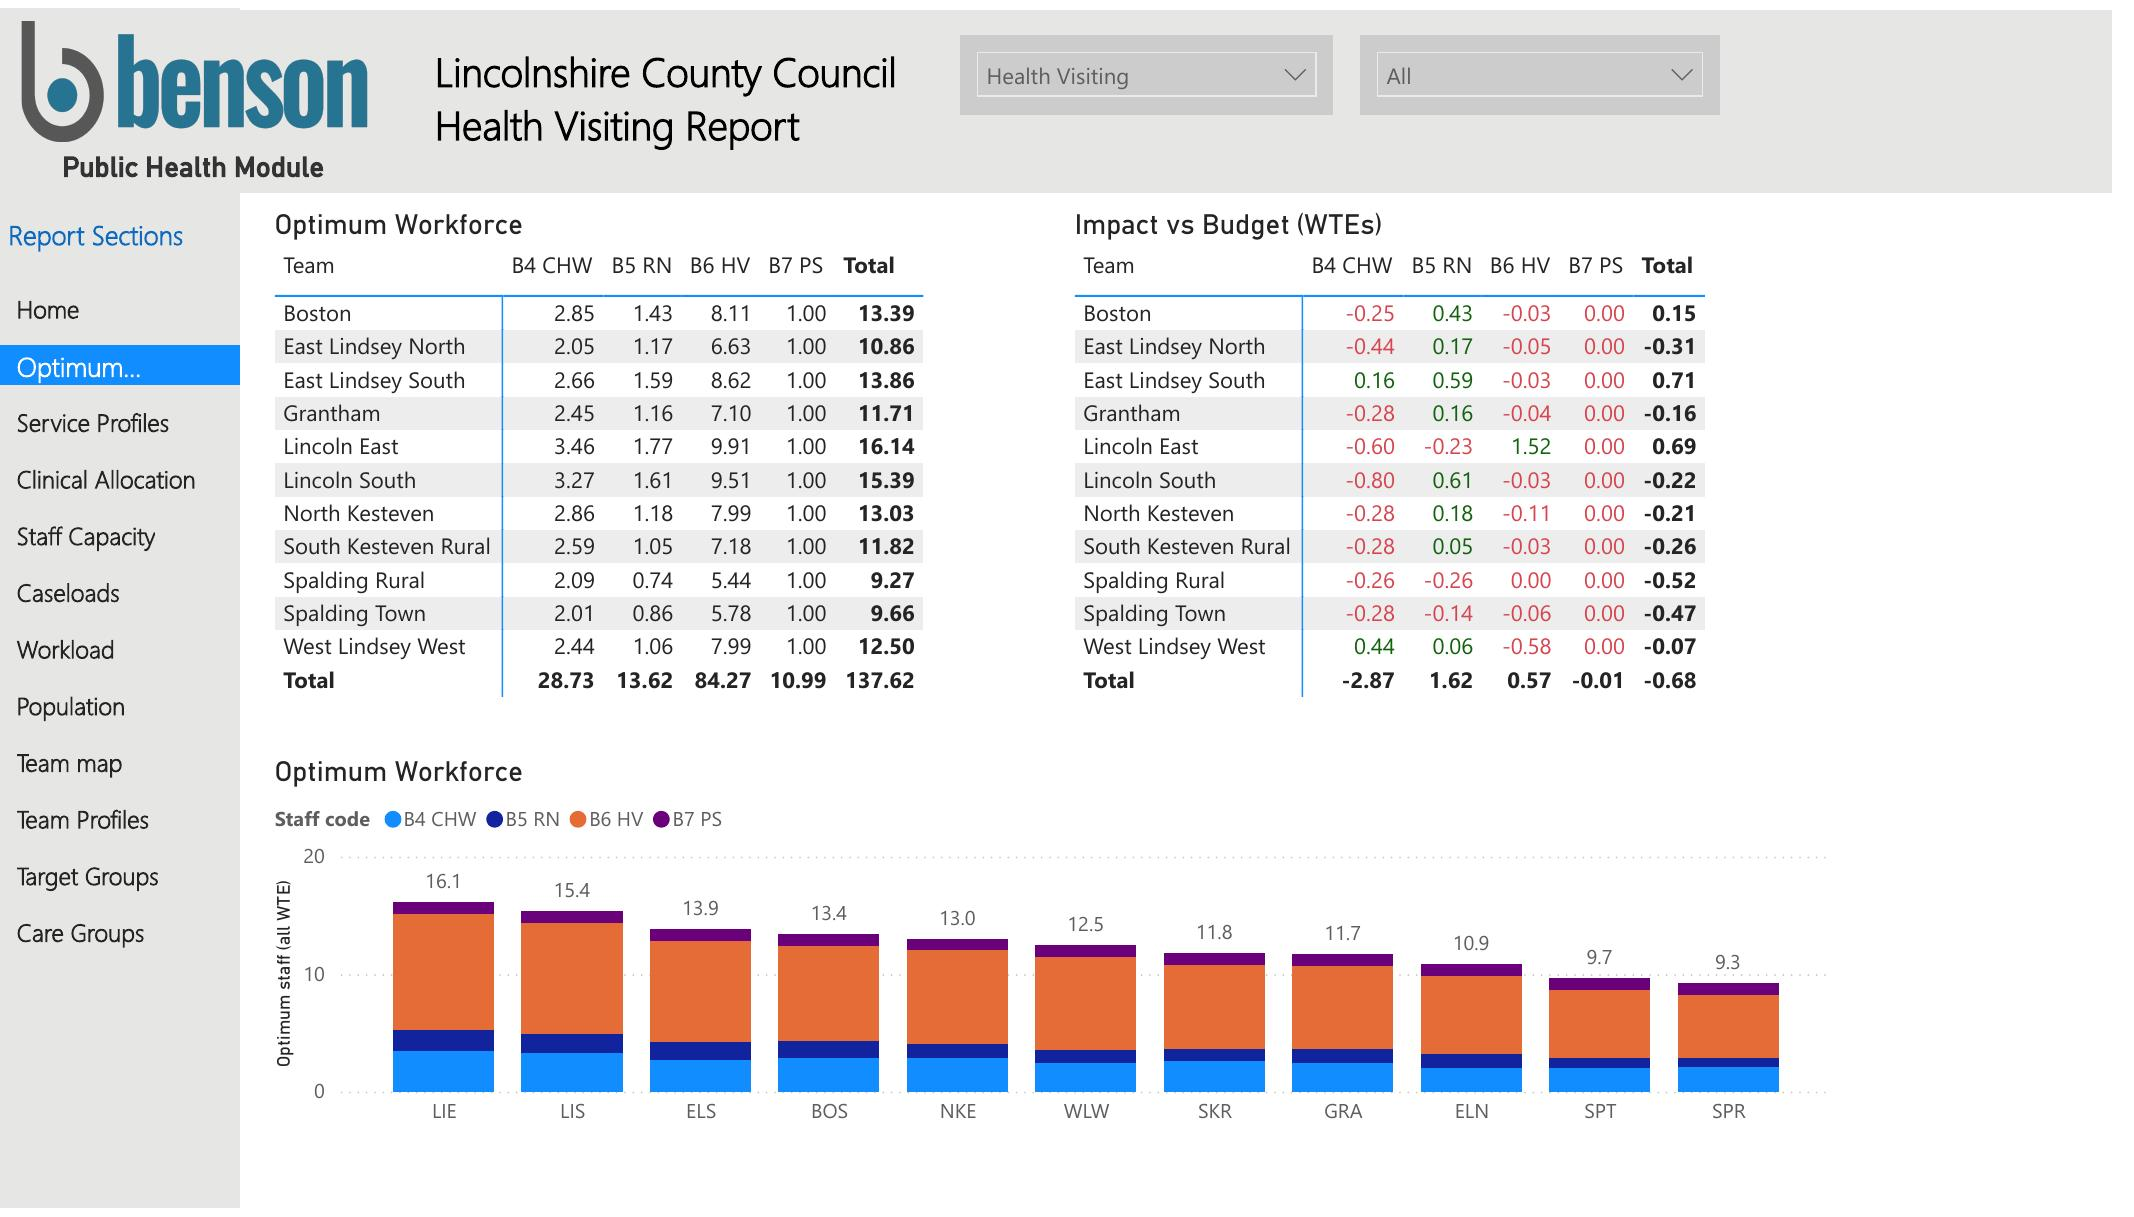
Scenario planningWorkforce requirements, assumptions and scenario impacts.
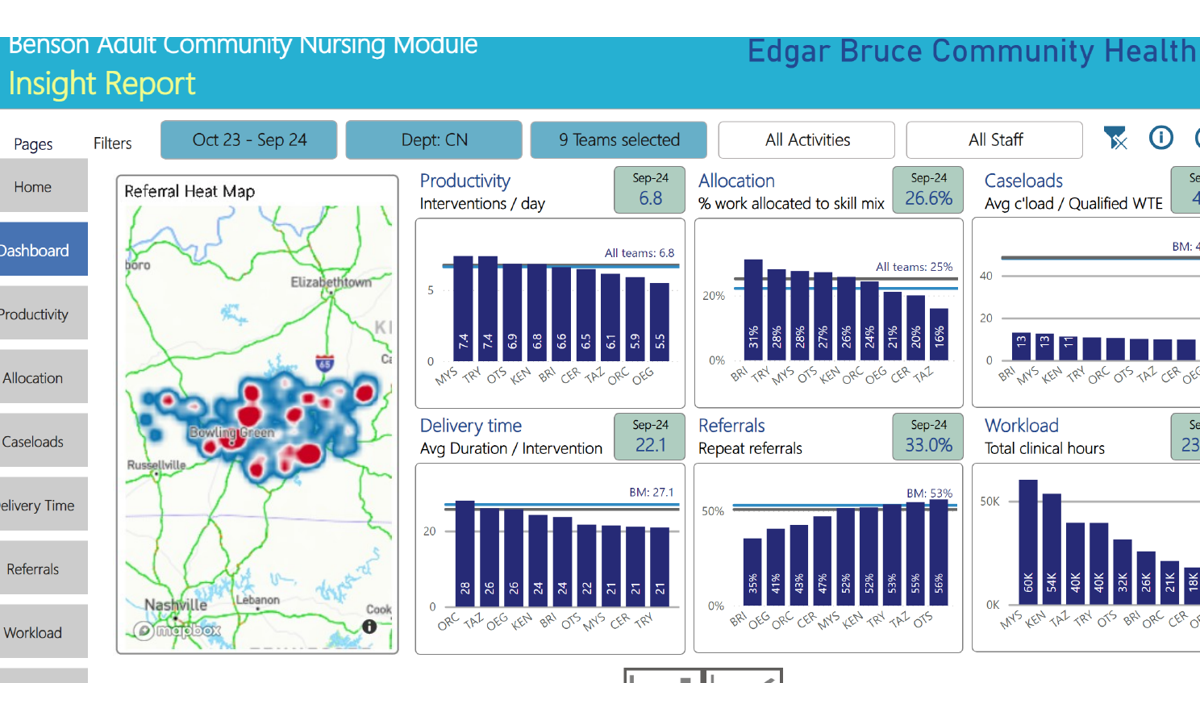
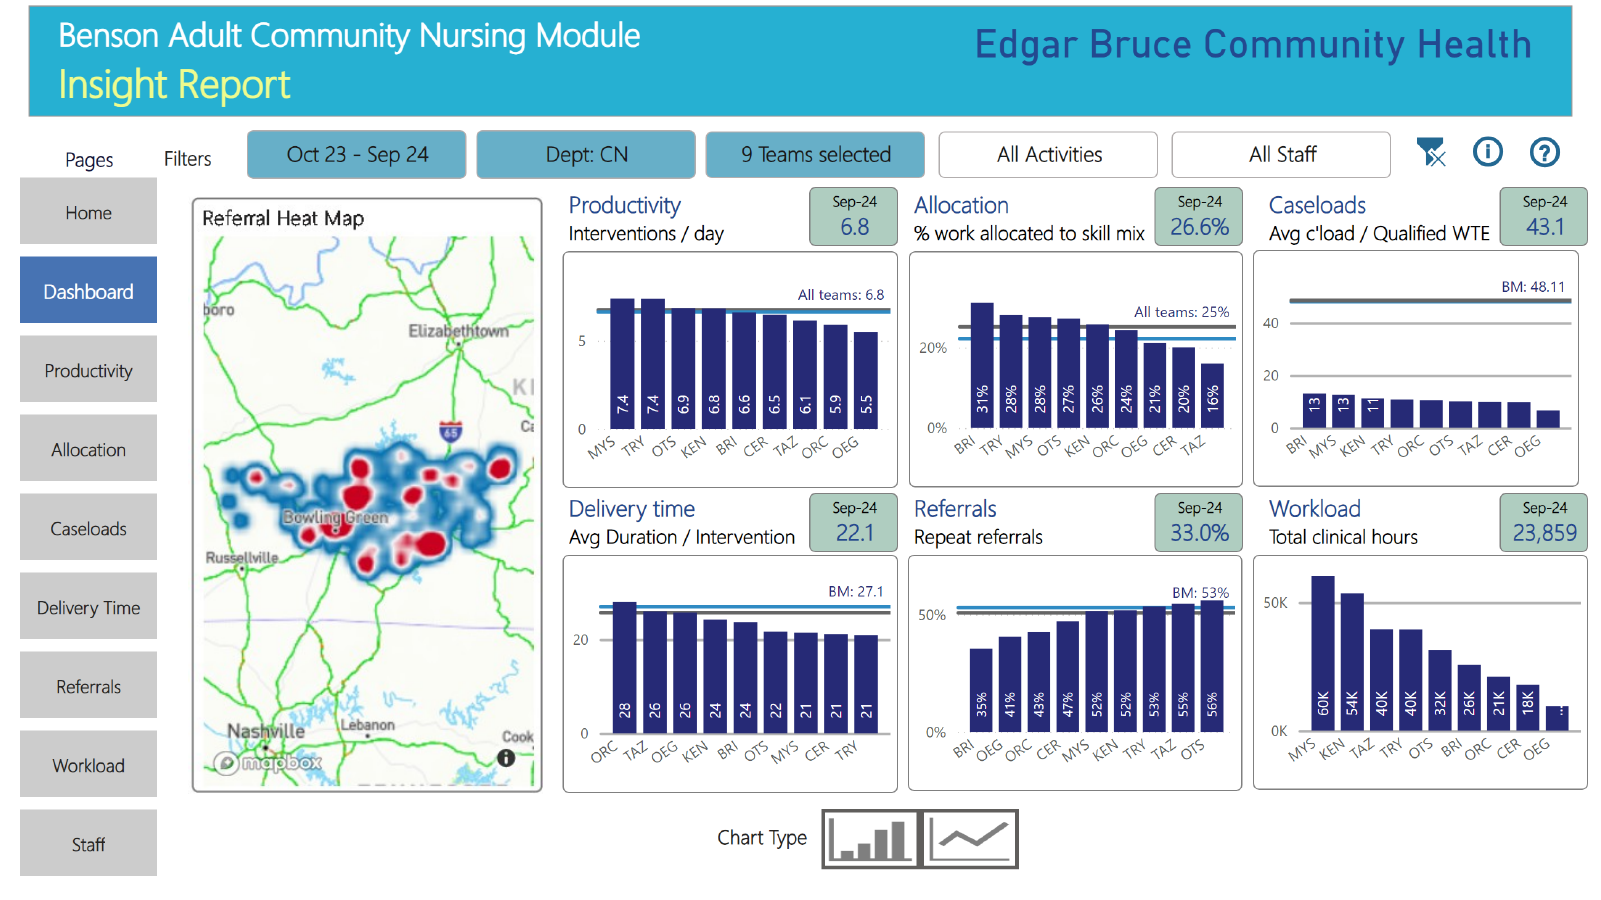
Benson Insight Report dashboard
Insight reportingProductivity, allocation, caseload, referrals, workload and geography.
Configure, adopt, expand

Start with what matters now, then build from a trusted foundation.

Benson is configured around your existing systems and services rather than built from scratch.

See the implementation approach →
1DefineAgree scope, priorities, measures and responsibilities.
2Connect & baselineMap the data, validate quality and establish the historic position.
3Configure & automateAdapt the Benson framework and automate repeatable processing.
4Roll out & trainValidate outputs, configure access and build local capability.
5Refresh & improveUpdate routinely, refine assumptions and expand into planning and transformation.
Start with one service. Extend across the organisation.

Connect Benson where the immediate problem is, then reuse the capability.

Start with District Nursing, Therapies, Health Visiting, School Nursing, CAMHS, CMHTs or another service. Once the data, definitions and reporting are established, additional disciplines can use the same automated intelligence and planning environment.

District NursingTherapiesHealth VisitingSchool NursingCAMHSCMHT

Explore how the model works in practice.

Start with the evidence, the methodology and the outputs. Then decide whether it fits your service.

View real outputs