
Why do apparently similar teams perform differently?
Bring together productivity, caseload, work allocation, travel, skill mix and demand to identify meaningful variation, better practice and improvement opportunities.
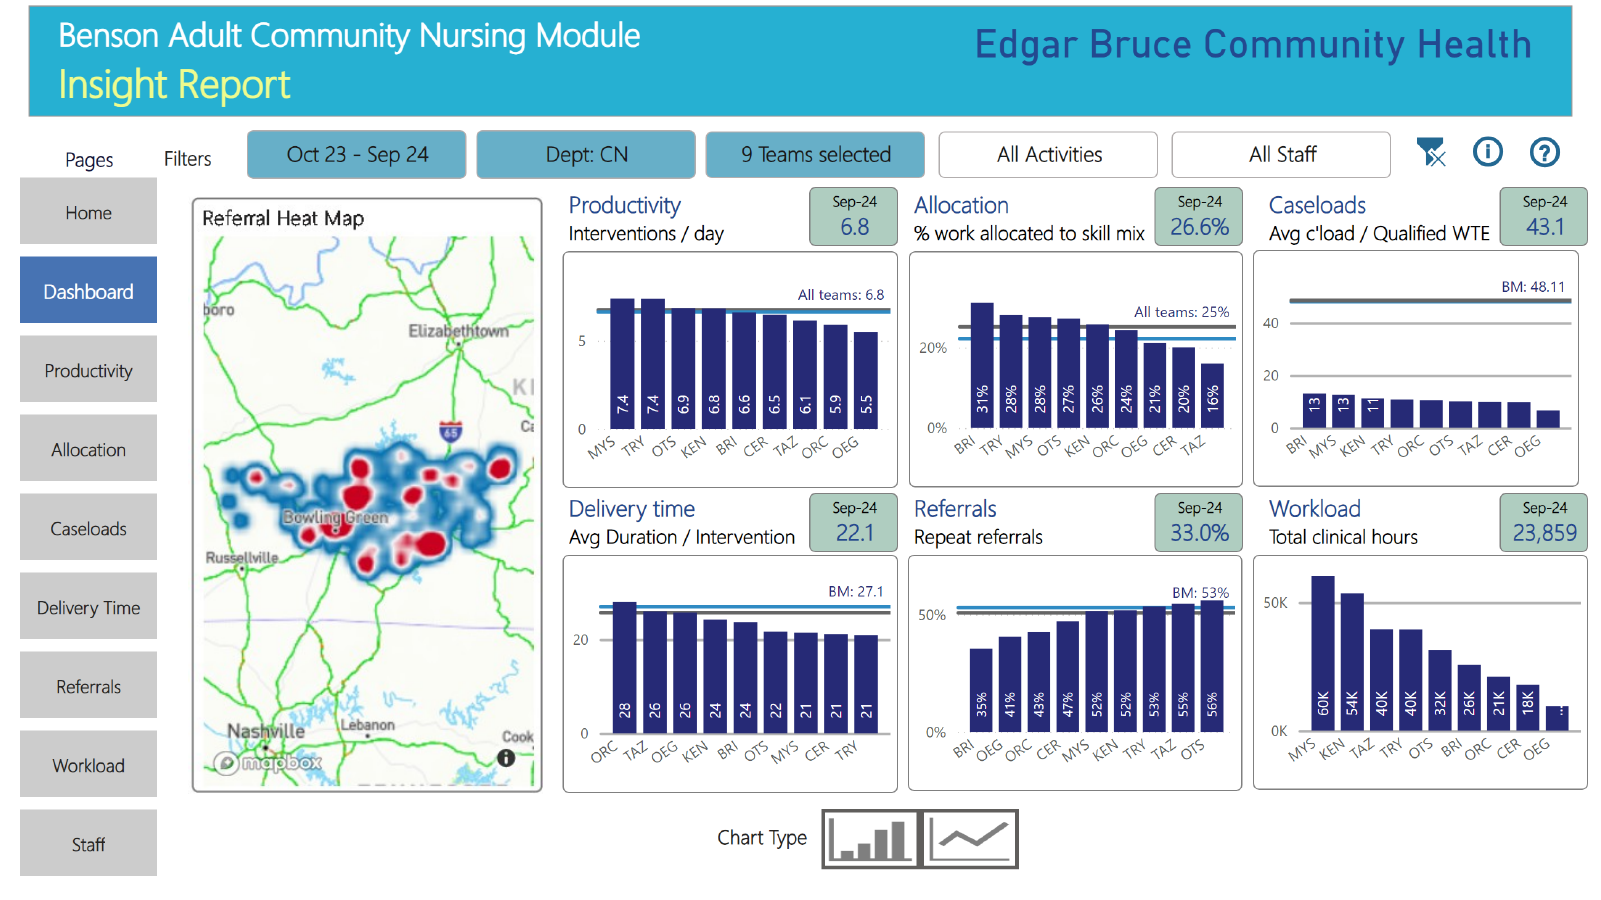
More reporting does not automatically create improvement. The value comes from understanding why performance differs and what can be changed.
Typical questions we help answer
- Which variation is justified and which is actionable?
- Are staff and teams allocated work consistently?
- What can we learn from better-performing teams?
- Where is capacity being lost?
- Did the transformation programme actually change performance?
The full operating picture - not one headline KPI.
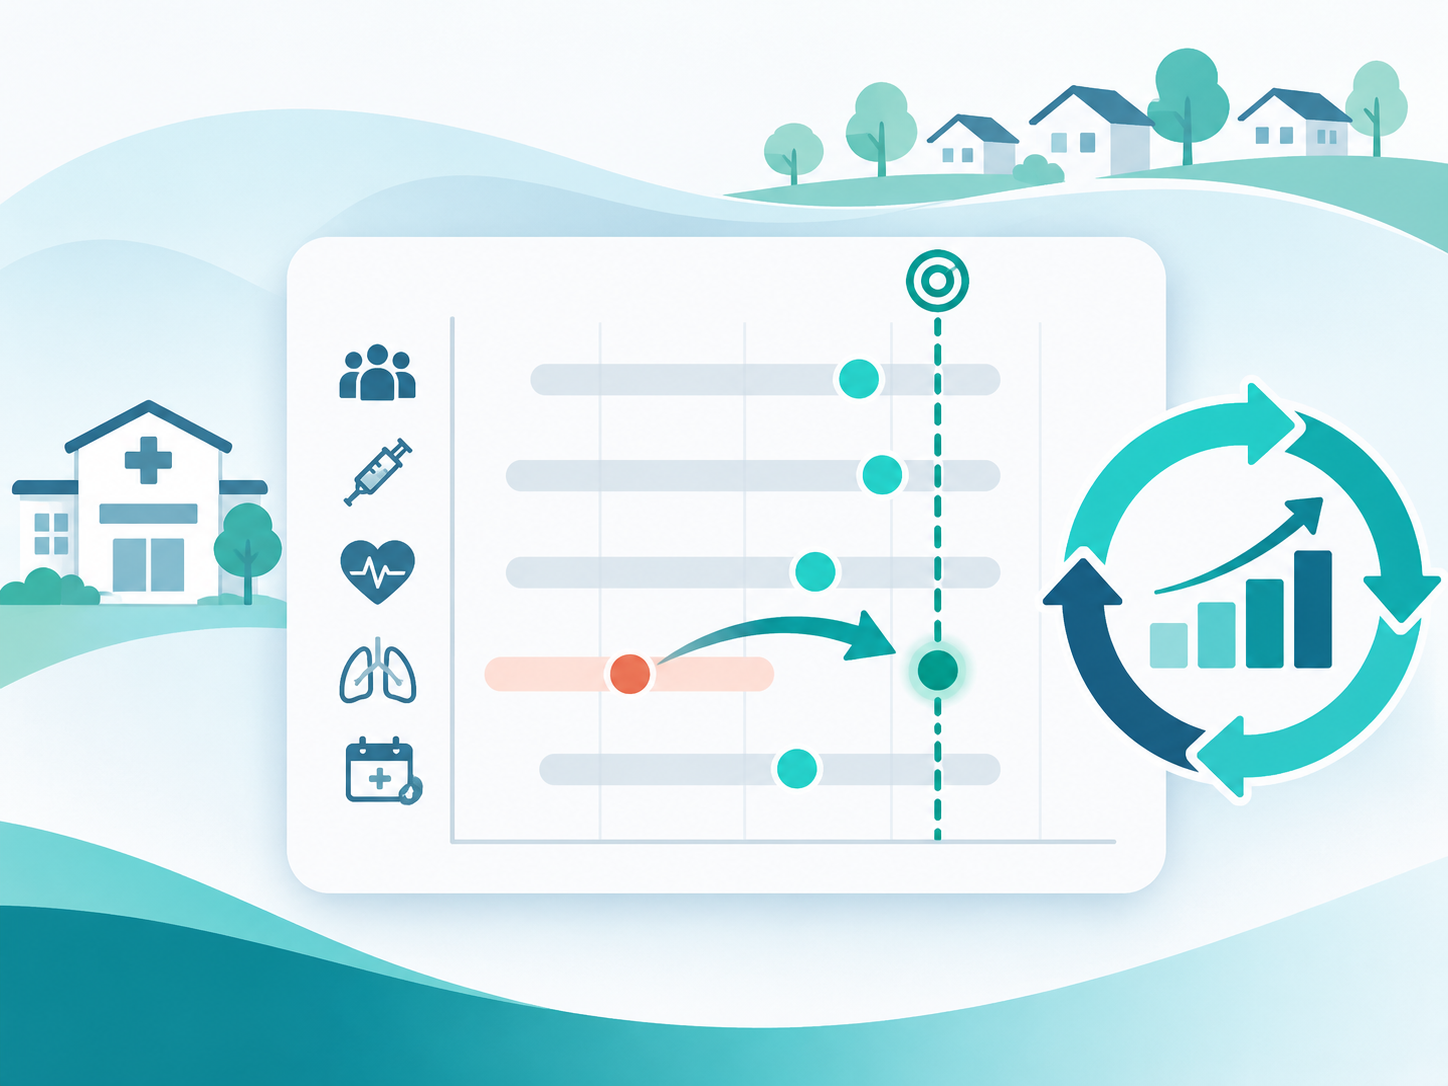
Practical outputs your teams can use.
Use the same model to plan and track improvement.
Create a feedback loop: baseline → opportunity → strategy → implementation → measurement → adjustment.
Automate the reporting. Let local analysts build on it.
Benson hardwires recurring processing from existing systems, establishes the validated Power BI data model, definitions and community measures, and gives your analysts access to that governed foundation so they can build and extend bespoke reporting themselves.
- Reduce repeated exports and spreadsheet handling
- Standardise measures and definitions once
- Distribute reports, plans and resources through the Benson App
- Manage users and access locally
- Extend the model into additional community disciplines
Routine reporting is automated while the local analytics team can use the same measures, definitions and model to create additional reporting and investigation.
Performance, Variation & Improvement
Start with one service or one problem. Build from there once the model is working.
Arrange a conversation